
Peter Drucker, one of the most famous management consultants of the last century, once said: “You can’t manage what you can’t measure.”
There is plenty of material available on SaaS metrics; we will reference a few valuable resources in this section. However, it’s important to keep in mind that a product-led GTM strategy, as we have shown throughout this book, changes the traditional sales funnel, replacing MQLs and SQLs with PQLs. Moreover, a product-led approach enables teams to track and measure in-product customer behaviors and correlate them with crucial SaaS metrics, such as CLV,CAC, and others.
Simply put, a product-led approach slightly changes the focus of what and how we measure success and effectiveness. SaaS companies are unique in how they acquire and retain customers. They invest significant resources in acquiring customers up front, and then recover the costs and realize revenue through the lifetime relationship with each customer. First, let’s look closely at how to track customer progression through a lifecycle.
A product-led strategy changes how companies track the effectiveness of customers moving through different lifecycle stages: from signup to PQL, from PQL to customer, and from customer to active customer. Each ratio helps identify bottlenecks in the lifecycle where customers experience a value gap and fall off the process.
With a product-led customer acquisition strategy, companies start gathering valuable behavior data early in the customer lifecycle, which increases team effectiveness in re-engaging customers with the product. By understanding conversion processes along the customer lifecycle, companies can design timely engagement campaigns to encourage customers to return to, and actively use, their product.
Let’s quickly review the seven user states in the customer lifecycle:
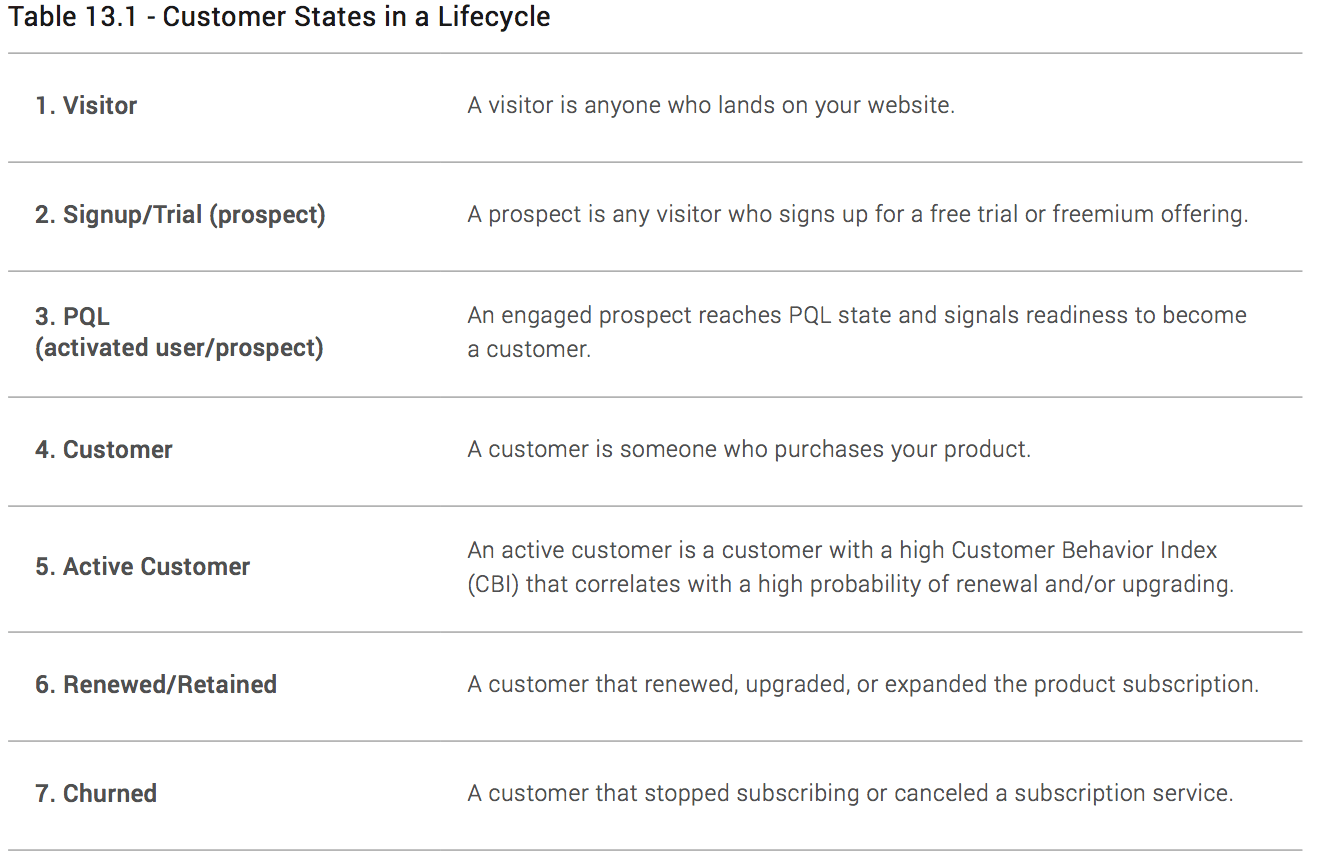
The initial goal for SaaS companies is to convert visitors to signups. At signup stage, the team can collect profile, company, and in-product behavioral data. Using this data allows teams to deliver timely engagements with the customer through in-product, mobile, or e-mail messages. Then companies can nurture prospects until they show enough interest in the product based on their product usage. Prospects that reach PQL stage are engaged by the sales team to assist in buying or in helping them increase product usage. Tracking customer behavior inside the product enables companies to predict and mitigate customer churn, and forecast CLV.
But let’s take a step back and explore how tracking conversion rates is an effective way to understand how prospects and customers progress through the customer lifecycle.
Conversion rate from one state to the next in the lifecycle helps companies understand what part of the lifecycle can be improved. At the same time, sales can more accurately forecast when they understand conversion rates.
Let’s review the basic conversion rates that companies have to track to understand how successful they are in progressing a prospect through the customer lifecycle.
Visitor-to-Signup Rate is the percentage of visitors that visit your page and then sign up. It is calculated by dividing the number of product signups by the number of visitors to a signup page. The visitor-to-signup rate shows how effectively your company convinces visitors to sign up for free trials or a freemium.
Signup-to-PQL Rate is the percentage of prospects that complete profile and in-product engagement requirements to become PQLs. It is calculated by dividing the number of PQLs by the number of signups. The signup-to-PQL rate provides insights into how effectively your company engages prospects in the early stages of reaching initial value.
Note: In some cases, it makes sense to analyze signup-to-PQL rate in terms of individual and account signups.
PQL-to-Customer Rate is the percentage of PQLs that convert to customers. It is calculated by dividing the number of customers by the number of PQLs. The PQL-to-customer rate shows how effectively your company converts PQLs to customers.
Signup-to-Customer Rate is the percentage of signups that become paying customers. It is calculated by dividing the number of customers by the number of signups. The signup-to-customer rate shows how your company, on average, converts signups to customers.
Customer Churn Rate is the percentage of customers lost due to churn (i.e., cancellation or failure to renew). It is calculated by dividing the number of churned customers by the number of customers at the start of the period for which the churn rate is calculated.